

Browserbase Session Monitoring
When running on Browserbase, you gain access to comprehensive cloud-based monitoring and session management through the Browserbase API and dashboard.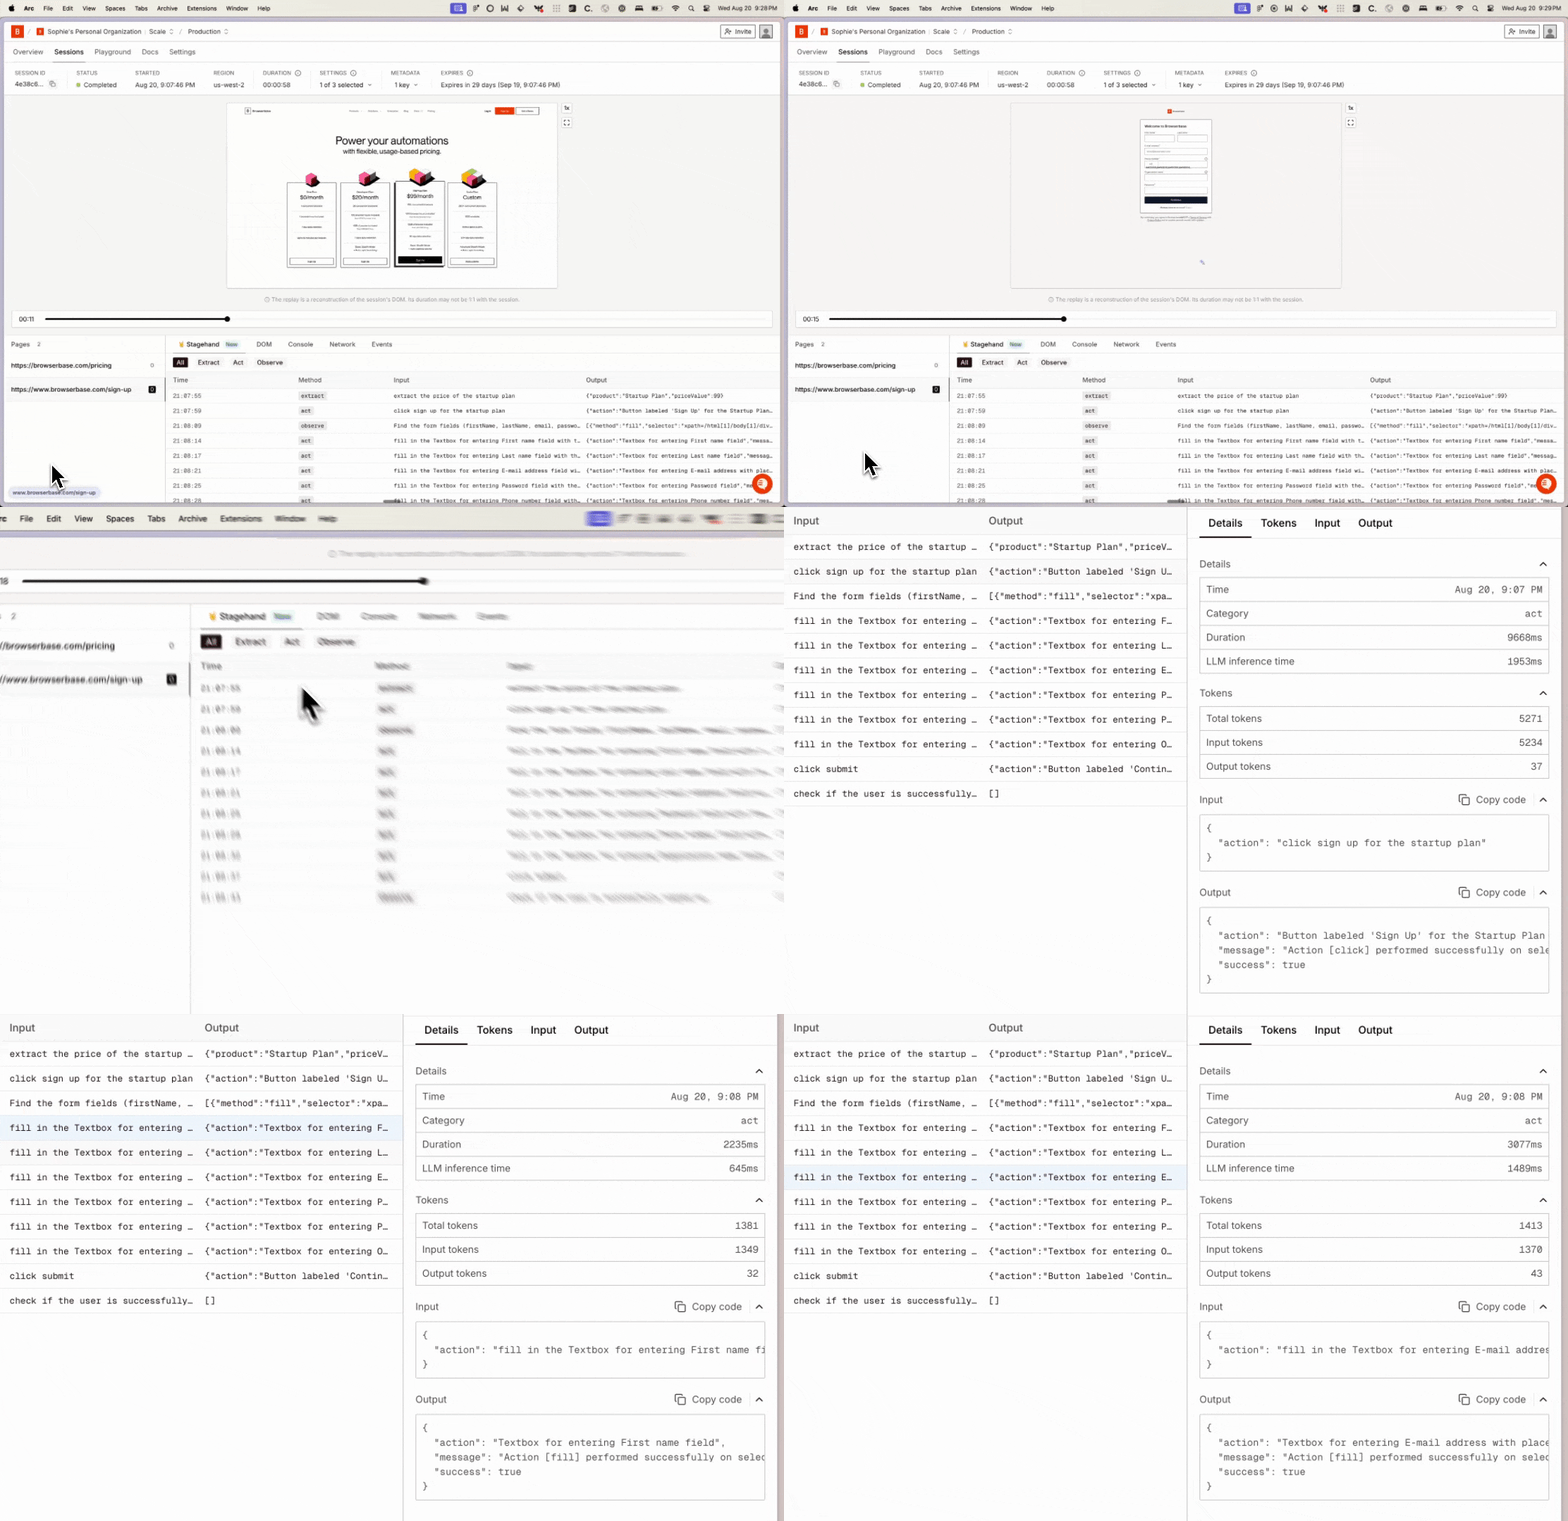
Live Session Visibility
Browserbase provides real-time visibility into your automation sessions: Session Dashboard Features- Real-time browser screen recording and replay
- Network request monitoring with detailed timing
- JavaScript console logs and error tracking
- CPU and memory usage metrics
- Session status and duration tracking
Session Analytics & Insights
Real-Time Monitoring
Monitor live session status, resource usage, and geographic distribution. Scale and manage concurrent sessions with real-time insights.
Session Recordings
Review complete session recordings with frame-by-frame playback. Analyze network requests and debug browser interactions visually.
API Management
Programmatically access session data, automate lifecycle management, and integrate with monitoring systems through our API.
Usage Monitoring
Track resource consumption, session duration, and API usage. Get detailed breakdowns of costs and utilization across your automation.
Session Monitoring & Filtering
Query and monitor sessions by status and metadata:Local Environment Monitoring
For local development, Stagehand provides performance monitoring and resource tracking capabilities directly on your machine.Performance Tracking
Resource Usage Monitoring
When running locally, monitor system resource usage and browser performance:LLM Usage
Monitor token usage, costs, and speed. Set up automated alerting for critical failures. Implement cost tracking across different environments. Use session analytics to optimize automation workflows.
Real-Time Metrics & Monitoring
Basic Usage Tracking
Monitor your automation’s resource usage in real-time withstagehand.metrics:
Understanding Metrics Data
The metrics object provides detailed breakdown by Stagehand operation:Best Practices
Production Monitoring
Production Monitoring
- Track session success rates and failure patterns
- Monitor resource usage and scaling requirements
- Set up automated alerting for critical failures
- Implement cost tracking across different environments
- Use session analytics to optimize automation workflows
Performance Optimization
Performance Optimization
- Compare Browserbase vs local execution times
- Monitor token usage and inference costs across models
- Track geographic performance differences
- Identify bottlenecks in automation workflows
- Optimize for cost-effectiveness and speed
Operational Insights
Operational Insights
- Track session distribution across regions
- Monitor concurrent session limits and scaling
- Analyze failure patterns and common error scenarios
- Use session recordings for root cause analysis
- Implement custom metadata for workflow categorization
Integration & Alerting
Integration & Alerting
- Integrate session APIs with monitoring dashboards
- Set up automated notifications for session failures
- Track SLA compliance and performance benchmarks
- Monitor resource costs and usage patterns
- Use analytics data for capacity planning and optimization
Next Steps
History Tracking
Track all LLM operations with parameters, results, and timestamps for debugging.
Logging
Configure logging levels, custom loggers, and file-based session logging.